Since 2018, Climate Portraits has been supporting practitioners, researchers and decision-makers in understanding climate change in Quebec. Thanks to its intuitive visualizations of historical and projected data, this platform has quickly become an essential tool to support the study of impacts and adaptation solutions. The Ouranos team works tirelessly to offer an ever more accurate and comprehensive tool to help anticipate climate change and its effects.
In this new version, Climate Portraits offers 3 new division options and some twenty additional climate indicators.
Here's a detailed look at the latest update.
New spatial division options
Climate Portraits now allows you to analyze the climate in a more granular way. The new map options offered meet the needs of municipalities and remote communities that are widely spread out, in particular. They enable climate risks to be assessed in a sufficiently localized way to effectively support adaptation action.
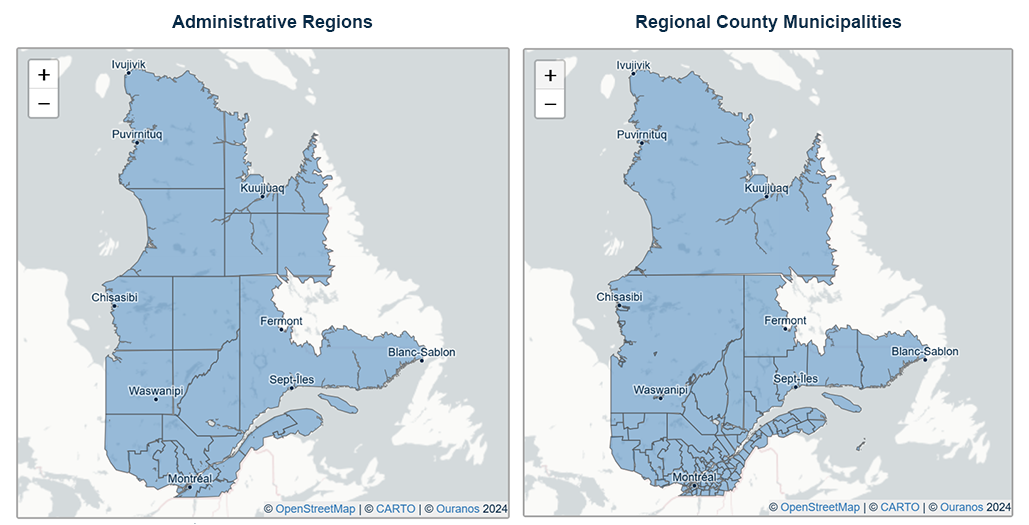
Regional County Municipalities
The addition of Regional County Municipalities (RCMs) as a spatial division option allows for better contextualization of climate data, particularly in southern Quebec, where the density of RCMs is higher.

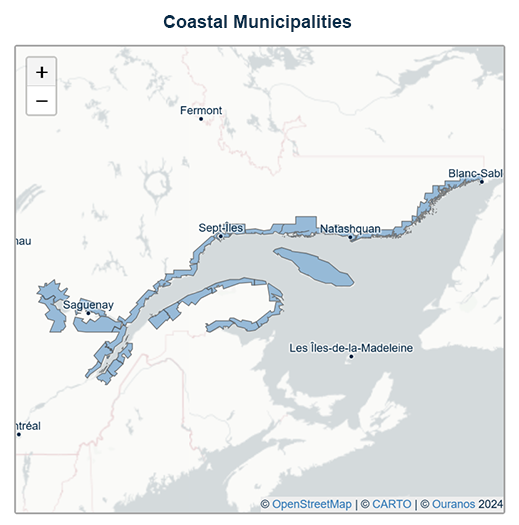
Coastal municipalities
Quebec’s coastal climates differ considerably from those inland. To better understand the specific issues facing coastal communities, which are sometimes in the minority within their RCM, a new map option has been added to Climate Portraits. It covers coastal municipalities along the Estuary and Gulf of St. Lawrence and along the shores of the Saguenay River and Lac Saint-Jean.

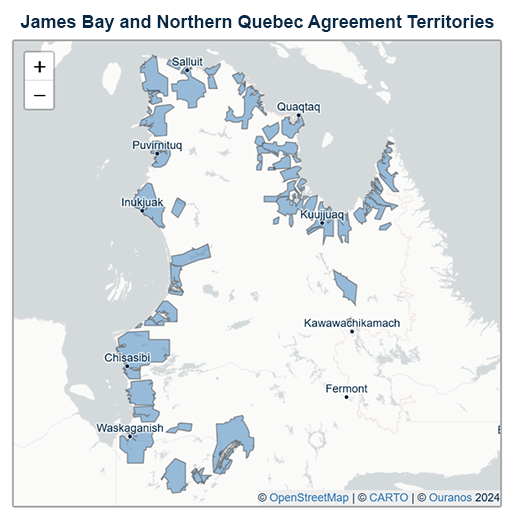
James Bay and Northern Quebec Agreement Territories
The Indigenous communities in northern Quebec, which are largely located on coasts, face distinct climate realities. By using the territories defined by the James Bay and Northern Quebec agreements as the basis for a spatial division, Climate Portraits now offers a more contextualized visualization of climate projections for these areas.

Climate indicators
Climate Portraits offers a detailed view of Quebec’s climate, for recent and futur periods, based on a multitude of indicators divided into five major families.
Five families of climate indicators
Temperature in general, and more specifically
Cold, freeze and thaw
Heat
Liquid, solid or total precipitation and its extremes
Freezing rain, which is a type of precipitation, but is treated in a specific way
Twenty indicators have been added to these families as part of this update. Each of these indicators is detailed below, demonstrating the richness and diversity of the data now available.
Plant and insect growth
The growing degree day indicator corresponds to the cumulative number of degree-days above the threshold allowing plants and certain insects to develop and grow. The basic threshold to be used differs depending on the plant or insect.
Base 5 is used for alfalfa, clover, peas, canola, safflower and asparagus
Building heating and air conditioning
The heating degree day indicator works in a similar way to the previous one, but is based on a temperature threshold below which a building must be heated to maintain the comfort of its inhabitants.
In contrast, the cooling indicator is based on thresholds above which air conditioning is required.
In both cases, these indicators can provide essential pointers for planning future energy demand and building design.
Frost-free season
Four new climate indicators having to do with the annual frost-free period have been added. Now, you can view the start, end and duration of the frost-free season across the province. The frost-free degree day indicator represents the cumulative number of degree-days above the freezing point.
Cold nights and warm nights
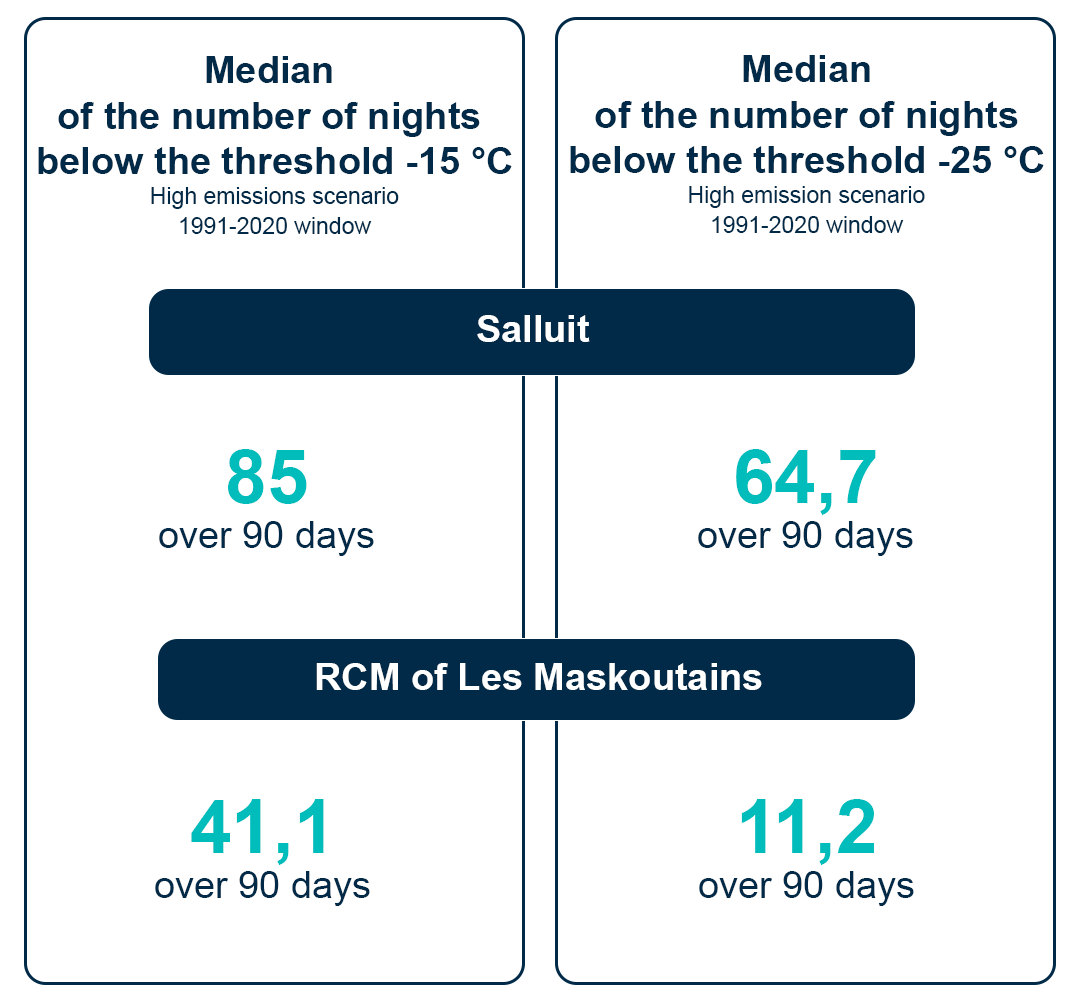
Climate Portraits already offers the climate indicator of cold nights with a -25°C threshold. The update introduces a new indicator with a threshold of -15°C for a more detailed analysis of cold spells.
The concept of a “cold night” varies across Quebec. The figure on the left illustrates this variability by showing the medians of the number of cold nights based on the two possible thresholds in Climate Portraits for two areas. This indicator provides a better understanding of regional differences in terms of cold nights.

The same logic applies to the number of warm nights indicator. The 18°C threshold was added to count the number of nights when the temperature was above this threshold; the 20°C and 22°C thresholds were already available.
The hottest day and the coldest day
These two indicators, respectively, calculate the lowest of the daily minimum temperatures and the highest of the daily maximum temperatures over a given period, providing an overview of the minimum and maximum future temperatures.
Extreme cold snaps
A cold snap occurs when the average daily minimum and maximum temperatures each fall below a certain threshold for at least 2 consecutive days. These thresholds are based on an increased incidence of mortality.
The number of days of extreme cold, as well as the number of extreme cold snaps, can now be viewed on Climate Portraits.
Total and maximum precipitation
The term “precipitation” here refers to rain, snow or the sum of both.
Climate Portraits already offers total precipitation, as well as maximum precipitation over 5 consecutive days. The update enhances these indicators, with the addition of total precipitation from April to October and maximum single-day precipitation
Maximum single-day precipitation can be used to analyze the risk of storm flooding when drawing up a municipality’s climate plan.
Days of precipitation
The number of rainy days can be calculated using three different quantities: 1, 10 and 20 millimetres.
The 20 mm threshold is a relatively high amount of precipitation. The number of days when precipitation exceeds this threshold can provide key insight for drawing up a municipality’s climate plan.
Precipitation-free periods
A precipitation-free period represents the number of days on which the precipitation amounts to less than 1 millimetre.
You can now view the number of periods of at least 6 consecutive days without precipitation, as well as the number of days without precipitation.
Withdrawal of CMIP5
In the interest of updating the data, all the indicators based on CMIP5 global models have been removed from Climate Portraits. Only the data for freezing rain still refers to this generation of climate models; however, it is derived from regional CRCM5 simulations driven by global models.
To consult the new spatial division options and climate indicators, go to :